
[ Creality K2 Plus Dashboard for Home Assistant ]
A single-paste Home Assistant Lovelace dashboard for the Creality K2 Plus, built on the ha_creality_ws integration. Live camera, print status with ETA, temperature gauges, print controls, dual CFS filament tracking, and a 2-hour temperature graph — all stock Lovelace cards, no HACS front-end dependencies. Paste it, swap in your printer's entity prefix, done.
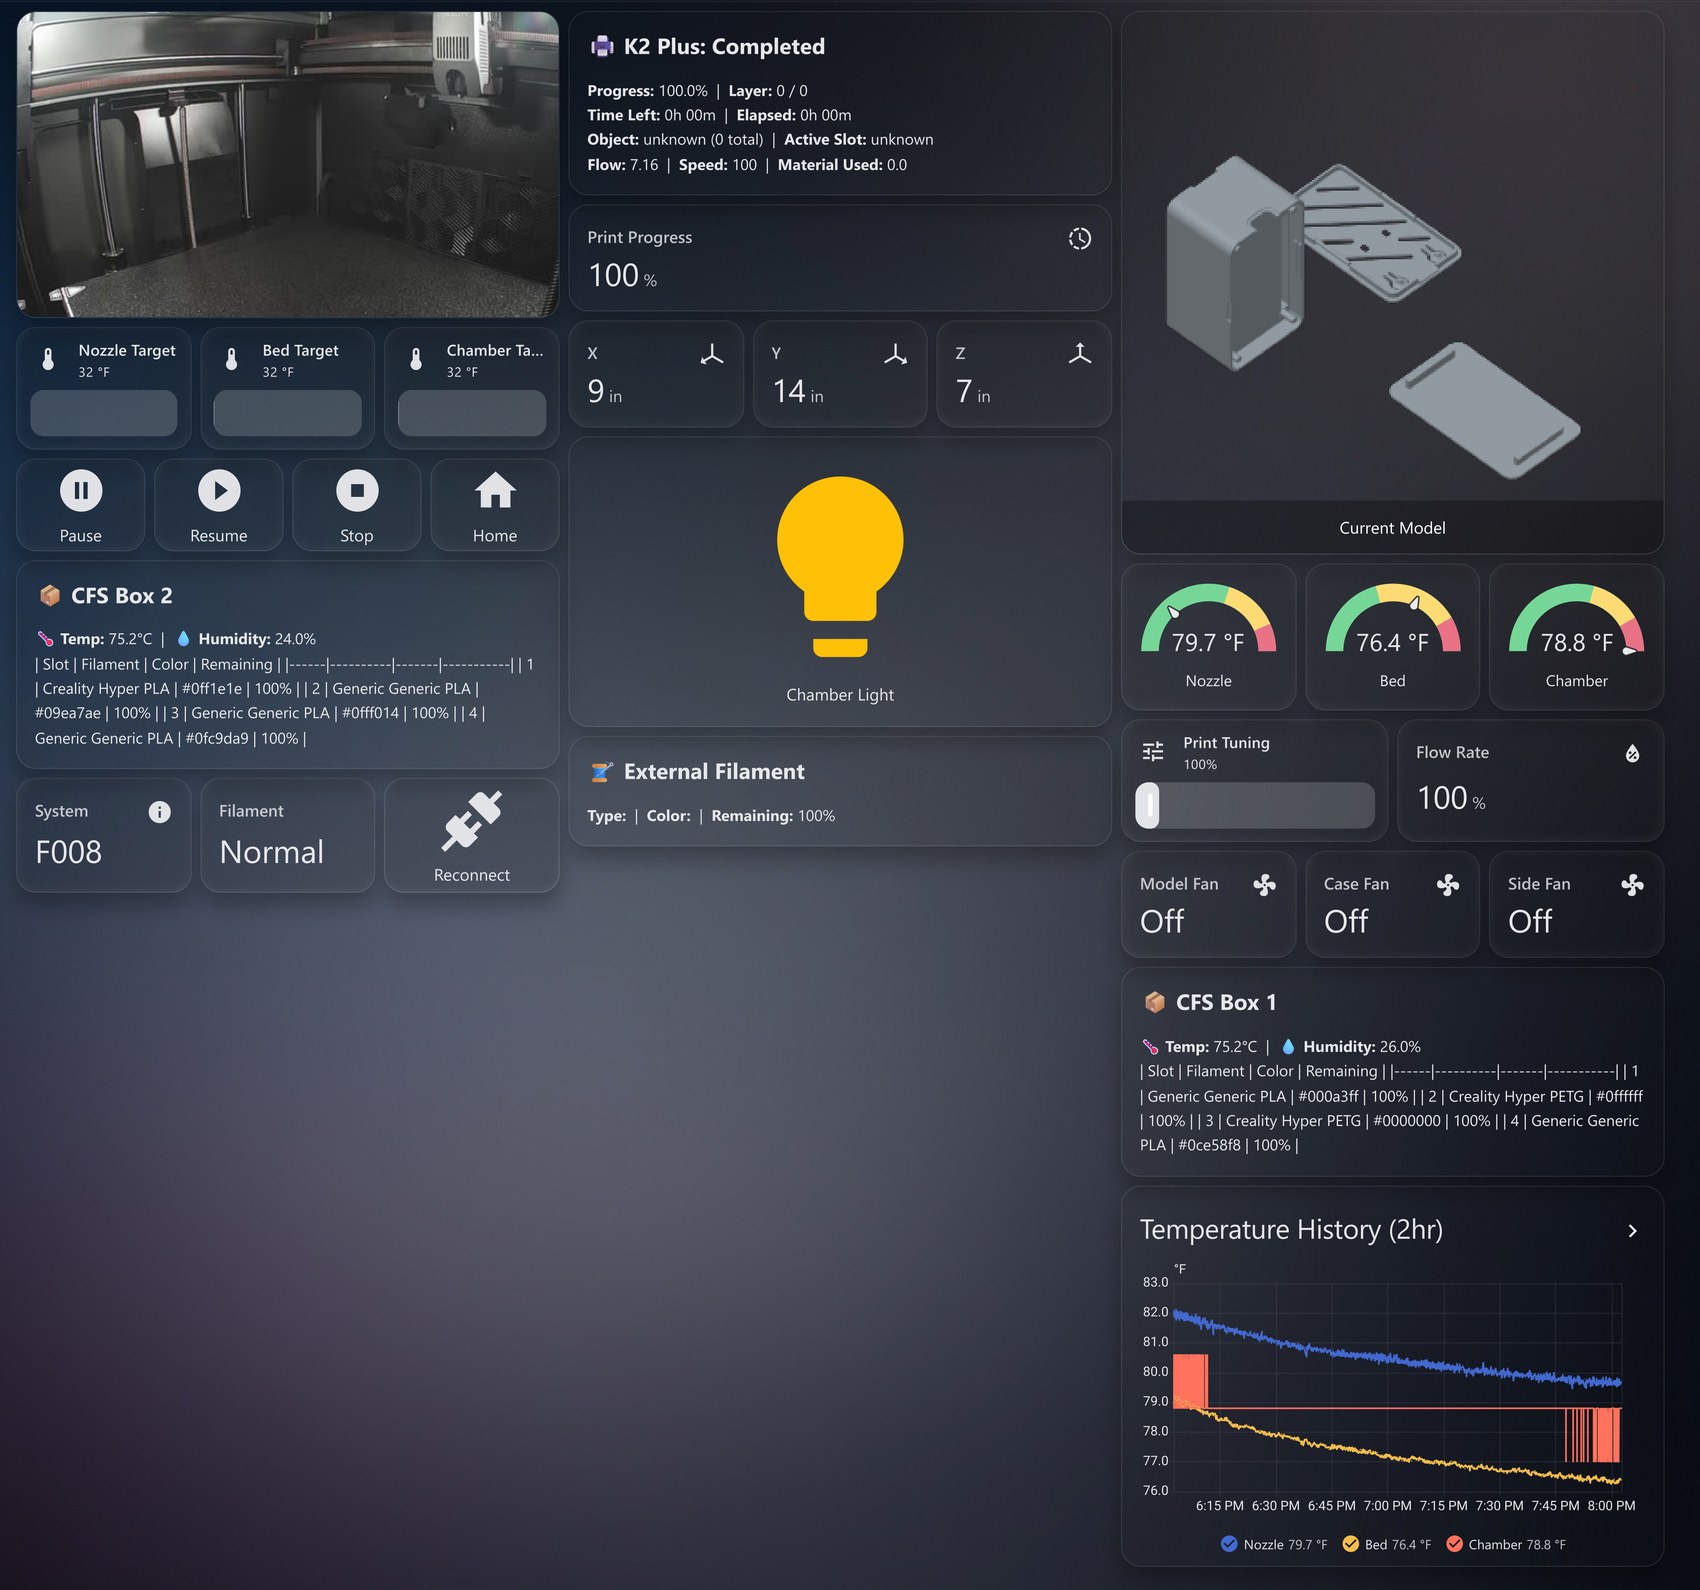
[ Overview ]
One dashboard view, three columns of cards, driven entirely by the entities
the ha_creality_ws integration exposes for the printer. It leans on
Home Assistant's built-in card types — markdown for the
status/filament read-outs, gauge for temperatures,
tile with a numeric-input slider for the setpoints,
and history-graph for the trend — so there is nothing to
install on the Lovelace side.
[ What it shows ]
  Live & status
    — chamber camera feed (picture-entity, auto view)
    — print status header: progress, layer, time-left + ETA, elapsed,
      object, active slot, flow, speed, material used
    — print-progress + current-model preview (auto-hide when idle)

  Temperatures
    — nozzle / bed / chamber gauges with green→yellow→red severity bands
    — nozzle / bed / chamber target sliders (inline numeric-input)
    — 2-hour temperature history graph (all three plotted)

  Motion & control
    — live X / Y / Z position
    — Pause, Resume, Stop (confirmation-guarded), Home
    — print-tuning slider + live flow-rate
    — chamber light toggle; model / case / side fan tiles

  Filament (CFS)
    — dual CFS box tables: temp, humidity, and 4 slots each
      (type, color, remaining %)
    — external-filament read-out

  System
    — system + filament status, one-tap reconnect button
    — attention banner appears only on error or stopped
The conditional cards are the nice touch: the banner and the progress /
preview cards use visibility: state conditions, so an idle printer
renders a clean board with no stale "0%" progress hanging around, and a stopped
or errored print pushes a red banner to the top.
[ Install ]
1. Add the integration. Install 3dg1luk43/ha_creality_ws through HACS, then add the printer by its local IP. It exposes the camera, sensors, number entities, light, fans, and press buttons the dashboard references.
2. Find your entity prefix. Every entity is namespaced with
a per-printer prefix (this dashboard ships with k2plus_1516). Find
yours in Developer Tools → Template:
{% raw %}{% for state in states %}
  {% if 'k2plus' in state.entity_id | lower %}
    {{ state.entity_id }}
  {% endif %}
{% endfor %}{% endraw %}
3. Swap the prefix. Find-and-replace
k2plus_1516 throughout the YAML with your prefix, then paste the
whole file into a new dashboard via the raw configuration editor
(three-dot menu → Edit dashboard → Raw configuration editor). That's
the entire install — no restart needed for a dashboard-only change.
[ Customizing ]
  Single CFS box   — delete the "CFS Box 2" markdown card
  No CFS box       — delete both "CFS Box" cards
  No external reel — delete the "External Filament" card
  °C vs °F         — follows your HA unit system; gauge max values
                     assume °F ranges, bump them for °C if needed
Every card is independent, so removing one never breaks the others. The
gauge severity bands and max values are the main thing
to sanity-check against your own material temperatures.
[ Source ]
One file, paste-ready (header comment carries the same setup notes):